From Stanford to Sisu: Making the Leap
People often ask me why I started working on Sisu. I didn’t get here by chance: even though we’re only two years old as a company, I’ve been working on new interfaces to analytics for over half a decade. And the more I spend time in this area, the more I believe that ranking and relevance for cloud data is the highest-impact opportunity in data today — so much so, that I’m all in.
Who needs a faster database?
In 2015, I was a twenty-five-year-old who’d just signed up for a seven-year run on the tenure track at Stanford, eager to make my name as a newly-minted assistant professor of computer science.
The safe thing would have been to continue to work on my dissertation area of distributed transaction processing. At Berkeley, I’d spent four years studying how to make databases faster, specifically by building systems that only communicated when provably, strictly necessary. Especially with databases located on different sides of the planet, coordination is expensive, and we showed it was possible to run conventional transaction workloads faster than anyone had ever before, by redesigning the entire concurrency control system to leverage application semantics to use as (provably) little coordination as necessary. While we made real progress, there are still at least ten solid dissertations to write in this area — perfect grist for the mill on the tenure track.
However, towards the end of my PhD, I started to notice something strange. Within a single data center, the fastest database systems in both research and practice were getting very fast. With a few hundred thousand dollars of hardware, you could execute one read-write transaction per minute for every person on the planet. What kind of user-facing applications needed more scale than that?
So, rather than focusing on just making databases faster, I started to dig deeper: where was this data coming from, and was database speed really the bottleneck I wanted to solve?
Even the database experts can’t understand queries fast enough
While pondering these questions and writing my dissertation, I spent a few months in Cambridge at MIT working with Sam Madden, a renowned database professor who’d also co-founded a startup called Cambridge Mobile Telematics (CMT) based on his research on mobile driving.
Sam knows databases — his lab built the columnar database prototypes that became Vertica — and yet, at CMT, his team kept running into a simple problem: out of the tens of thousands of different Android phone models that CMT’s software had to support, a handful would consistently cause problems with their software releases. The ML models in CMT’s applications were constantly improving, but because each phone handset had slightly different sensors, it was hard to calibrate the models for every type of phone up front. Each was release was slightly different, so they faced a moving target.
In response, Sam and his team had to manually write queries to slice and dice their data to figure out what had changed from one release to the next, and where to apply their effort. They had the data to figure out what had changed, but they didn’t have the time or energy to ask all the questions required to get the answer. Even if they wrote a script to automatically pose all possible questions, given a combinatorial number of possibilities, someone would have to manually pore through all the results. For CMT, people—not databases—were the bottleneck.
Given that one of the five-star wizards of database architecture was having a hard time understanding what combinations of releases, handsets, Internet Service Providers, and Android OS versions were affecting his business, how would anyone else in the world answer these kinds of questions?
A clean problem statement: Prioritizing attention
I found inspiration for Sam’s problem in a paper from 1971 called “Designing Organizations for an Information-Rich World” by Turing Award winner Herb Simon. As Simon wrote,
In an information-rich world, the wealth of information means a dearth of something else: a scarcity of whatever it is that information consumes. What information consumes is rather obvious: it consumes the attention of its recipients.
Given all of the data available in modern applications as well as the number of dimensions attached to each piece of data, this problem had only gotten worse — to the point that even the best database experts in the world couldn’t use their data.
Put another way, in a world with nearly-free data storage and nearly-infinite compute capacity, the bottleneck in analytics shifted, from compute to people. We didn’t need a faster database. We needed analytics engines that would help us make far better use of the data we had on hand. The decades-old mental model of people typing SQL queries into a console (or manually slicing and dicing in a Business Intelligence tool) finally had failed to scale.
Or, as we put it in an early position paper:
We believe that the impending era of fast data will be marked by an overabundance of data and a relative scarcity of resources to process and interpret it. That is, as data volumes continue to rise, human attention remains limited. information systems must — more than ever — assist in highlighting and contextualizing important behaviors, quickly and over large, diverse data sources. This problem is especially acute in tasks including data exploration, debugging of complex and predictive services, and high-volume monitoring.
From prototyping, we learned: There’s no silver bullet, but there are pipelines
Now, you can’t get tenure with just a vague idea. You have to execute.
So I started writing code. We began with a Python script to just solve Sam’s problem. Once we got that working — it was slow — we wrote some Rust. At the time, Rust didn’t have great support for sparse linear algebra, so we rewrote everything in Java, and built a web app and front end. It was a lot of engineering, which is often a dirty word in academia. But, the more I built, the more I realized a few deeper lessons:
- The solution to prioritizing attention in all of this data had to come from machine learning and statistics. There was no way that just running “faster SQL” would cut it; there were simply too many queries to run.
- At the same time, there was no silver bullet or single model to help people like Sam monitor and diagnose their metrics. The kind of ranking and relevance functionality we needed consisted of entire pipelines of operators — some to perform feature engineering and transform the data, some to classify it, and others to automatically aggregate the results and visualize them.
- Most of the literature looked at these problems in isolation. For example, it turns out “anomaly detection” and “outlier detection” are poorly defined terms: what makes something an “anomaly” is remarkably subjective, and every paper has a different definition for each. You could easily substitute the phrase “foobar detection” for “anomaly detection” and “outlier detection” and the results would make the same amount of sense.
- Almost nothing ran fast off the shelf. Most of the seminal work on high-volume, high-dimensional statistical inference (especially in sparse regimes) ran dog slow on data at scale, if you were lucky to find a working implementation. Even many streaming algorithms optimized for low memory usage, not for keeping up with insane volumes of data found in people’s data warehouses.
- Despite the fact that the idea of “prioritizing attention” was so nebulous and poorly defined, the advances in search over unstructured data from the mid-1990s through the 2010s was pretty good evidence that we could make progress. Concepts like inverted indexes that are now standard within every unstructured search engine dated to the 1950s. “All” it took were some smart people to put them to work in an end-to-end system — and a lot of data.
Use cases lead to users lead to optimizations lead to use cases
From all of this building, two things happened.
First, people started picking up the prototypes we built, and our lab continued making them better — more sophisticated, more powerful, and more adaptable. There wasn’t much like the software we were building, and we suddenly had users at manufacturing companies, electric car manufacturers, and video streaming sites using our prototypes.Then our friends and sponsors at big tech companies, like Microsoft and Google, joined in too. At one point, our overarching research project was the best-funded program of its kind in the entire department, then eventually the entire campus. This visibility and usage meant we got a lot of feedback, which made our work better.
Second, making practical algorithms actually run fast became our ticket to academic success. In the first two years at Stanford, my group published more papers than I’d expected to write during my entire tenure track — and won awards for them, all while getting things deployed (sometimes in full products, like Datadog) and even making contributions to basic science along the way.
On the technical front, I was surprised by how often looking at the way a model was actually deployed could enable new algorithmic and systems contributions, with meaningful speedups.
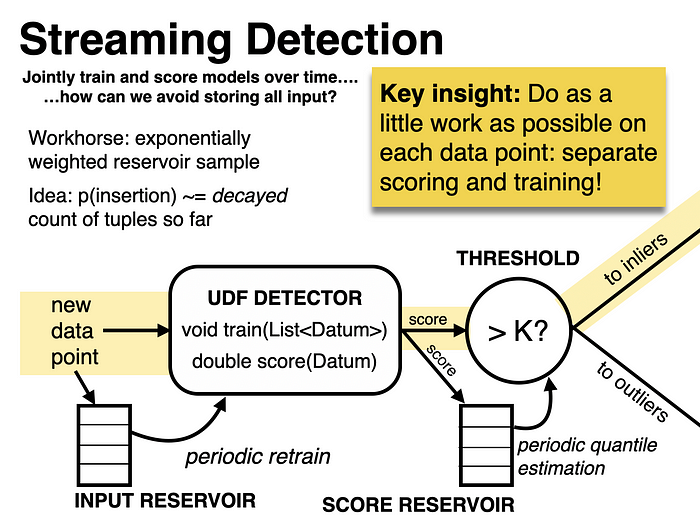
For example, if we wanted to identify statistically unlikely data points (as illustrated below), we could use an unsupervised density estimator to compute the probability of each data point in the dataset, then filter for unlikely data points. However, since we only need to classify whether probability densities are above a certain threshold, we can short-circuit the computation required for density estimation once we can be certain (via statistical bounds) that a given point is highly likely or highly unlikely. (Database people would call this predicate pushdown, but it’s complicated when applied to models.)
We developed several design patterns and interfaces for reordering computation and cutting off computation based on the entire pipeline composition. This was similar to what a relational database would do for relational database queries, but for useful statistical ranking and relevance operators that worked on structured and semi-structured data. As we liked to say: the fastest way to compute is to avoid computation. And the best way to do that is to know the entire computation you’re trying to perform.
As we saw new use cases, we’d add more operators to our toolkit. This in turn led to new scalability challenges. And opportunities for user interface and visualization design. And users.
In a world with near-free storage and nearly-infinite compute, we were developing a new kind of interface, where users would input their metrics, and we’d do the heavy lifting of searching and ranking outputs. It was good enough that people started building teams around the results, and talking about the results with their friends.
What about everyone else?
Despite this success, something kept me up at night. We hadn’t improved our production UX since I wrote our first prototypes. We saw companies like Microsoft incorporate our backend into their production systems, but we hadn’t really closed the loop with users for all of their analyses since the earliest days. I tried hard but couldn’t hire production engineers on campus to harden our codebase for people that couldn’t afford SRE and DevOps support for our research prototypes. But aside from the bleeding-edge tech companies, we had a hard time supporting sustained use. (I personally wrote our Oracle ODBC connector.) What about the rest of the world?
I decided to do something about it. Stanford’s rules allowed me to take two years “off” the tenure track to work full-time off campus, so I did. With an evolving future data stack that includes serious leaps in data pipelines (e.g., Fivetran) and data storage (e.g., Snowflake) infrastructure, the total addressable market for a product in this space was huge, and growing. We partnered with Ben Horowitz (and, soon after, Pete Sonsini) and were off to the races, bringing together the engineering, machine learning, and product chops to actually harden and productize a version of this ranking and relevance engine for the rest of the world.
There’s so much to say about our journey as a company, but one piece of advice that my mentor and former graduate school advisor Ali Ghodsi told me says it best: the best part of the job as CEO is being able to work with true experts across functions — not just engineering, but also in sales, marketing, product, design, and people — who are not only better than you at all these things, but also teach you about them as you build something bigger than any of you individually, together. On a personal note, I’ve learned more the past two years than I have in any period of my life — including graduate school. I’ve had to learn how to be a CEO, how to work with enterprise customers, how to fit this kind of capability into companies that aren’t “big tech,” how to throw a hard-hitting, independent technical event for hundreds of people — and I’ve learned all of this from the amazing, inspiring, thoughtful group of people that make up our growing team at Sisu.
Time’s up: Making the leap
Earlier this year, Stanford reminded me my two years on leave were up. It was time to come back to campus — use it or lose it, including any C-level title at the company.
Having worked for almost ten years to get to my position at Stanford, this was a painful call to make. Stanford is notoriously inflexible about its rules on leave, even for tenured faculty — just ask Sebastian Thrun, Daphne Koller, and Andrew Ng. I had a great group of students, a successful lab, and a bunch of research to continue exploring. According to most academics, I’d be crazy to say goodbye to campus.
But we’d just scratched the surface of what’s possible at Sisu. We’d built a fantastic team, seen rapid adoption in the market with great partners like Samsung, Gusto, Upwork, and Corsair. On a technical level, we’d blown past the scale of work we’d done on campus, with several publishable results based on our work that we’ve even now only started to write up. We had years of work ahead of us to fully realize the potential for this kind of product in a growing market, with great investors at our side, too.
Looking at this trade-off soberly, with my academic hat on, I still believe there are at least another twenty years of progress to make on the problem of ranking and relevance for structured data. However, at Sisu, I have more access to more use cases and data, with direct line-of-sight to real-world impact and ability to truly build human-in-the-loop systems on the bleeding edge—even beyond what academia can work towards in a CS laboratory setting. With my founder hat on, the opportunity to both knock out the technical wins and seize the potential market impact is massive. And with both hats on, working with a bright and bold team of experts across the stack is not only an amazing education but also a great privilege.
So, did I go back to Stanford?
Nope. I’ve decided: I’m finishing what I’ve started here at Sisu.
I can’t wait to see what the next two years have in store for us.
